Council Carbon Footprint

Information on the carbon footprint of our operations

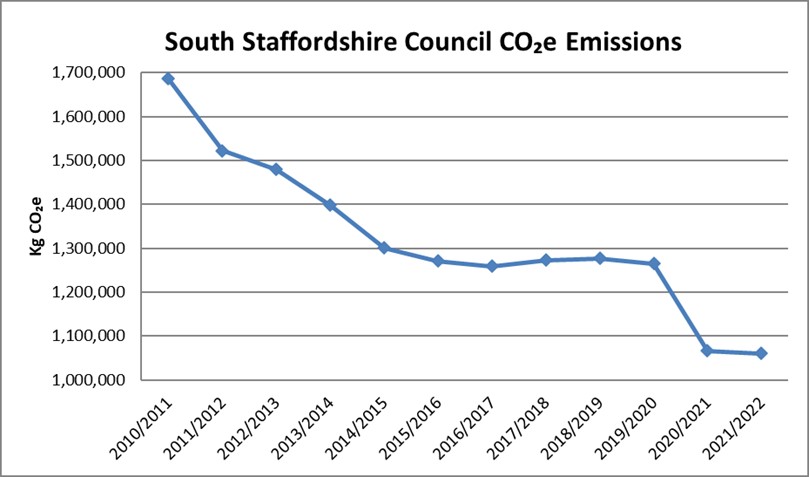
South Staffordshire Council collects and reports data covering the carbon footprint of our operations and delivery. This demonstrates our emissions in terms of kilograms of Carbon Dioxide equivalent, which is a universal unit of measurements used to indicate the global warming potential of greenhouse gas produced by the council.

Image
Graph illustrating South Staffordshire Council’s carbon footprint, illustrating a 37% reduction in carbon usage since reporting began in 2010.  The vertical Y axis measures carbon usage in kilograms of Carbon Dioxide Equivalent and horizontal X axis measures years in a timeline.
Title
Council Carbon Footprint Graph

Was this page useful?

A-Z of services

A B C D E F G H I J K L M N O P Q R S T U V W X Y Z